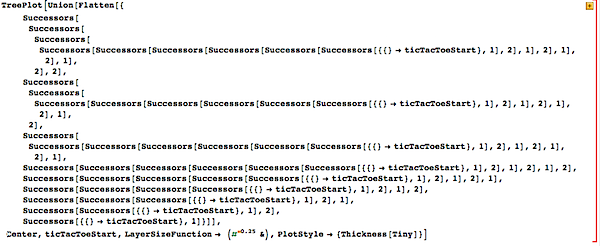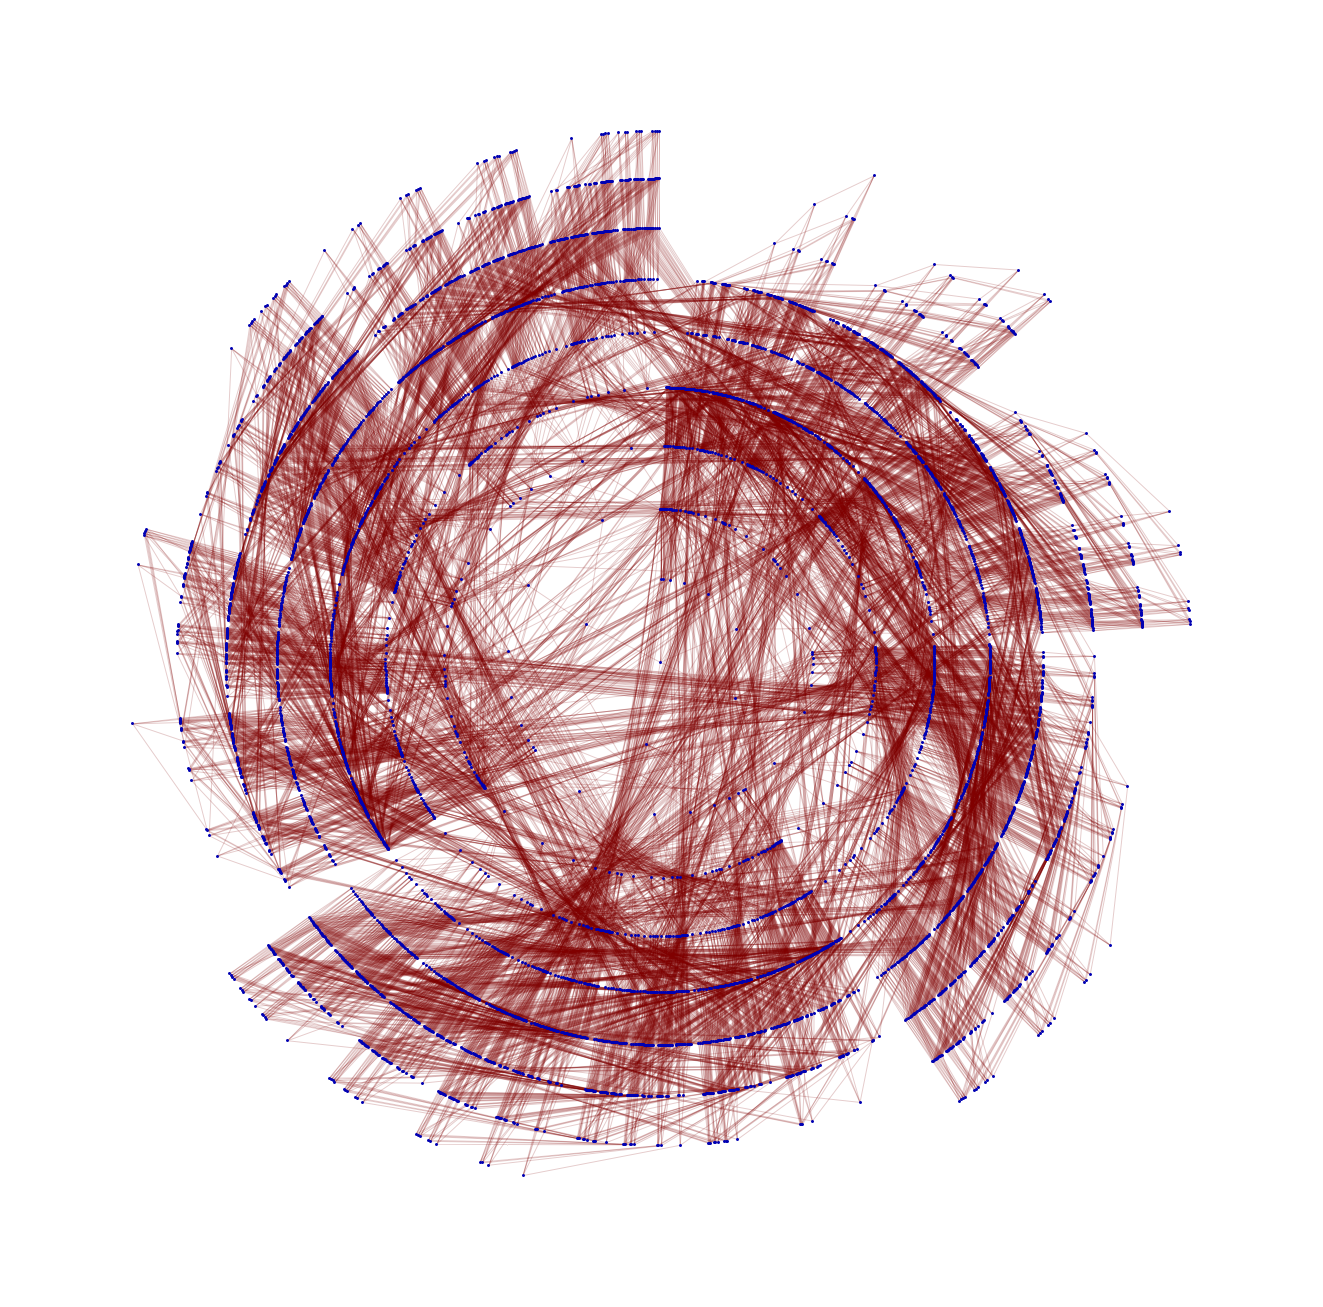
NOT the most elegant Mathematica, but trying to do clever things with NestList was a pain. And my math was creating duplicate transitions, which is why the other graphs were so dense – and the layer size needed to be tweaked a bit to show both the starting and ending states more clearly. But, after some cleanup, it worked, after a bit of churning (click the image for a larger size):
